When Everything Started Breaking
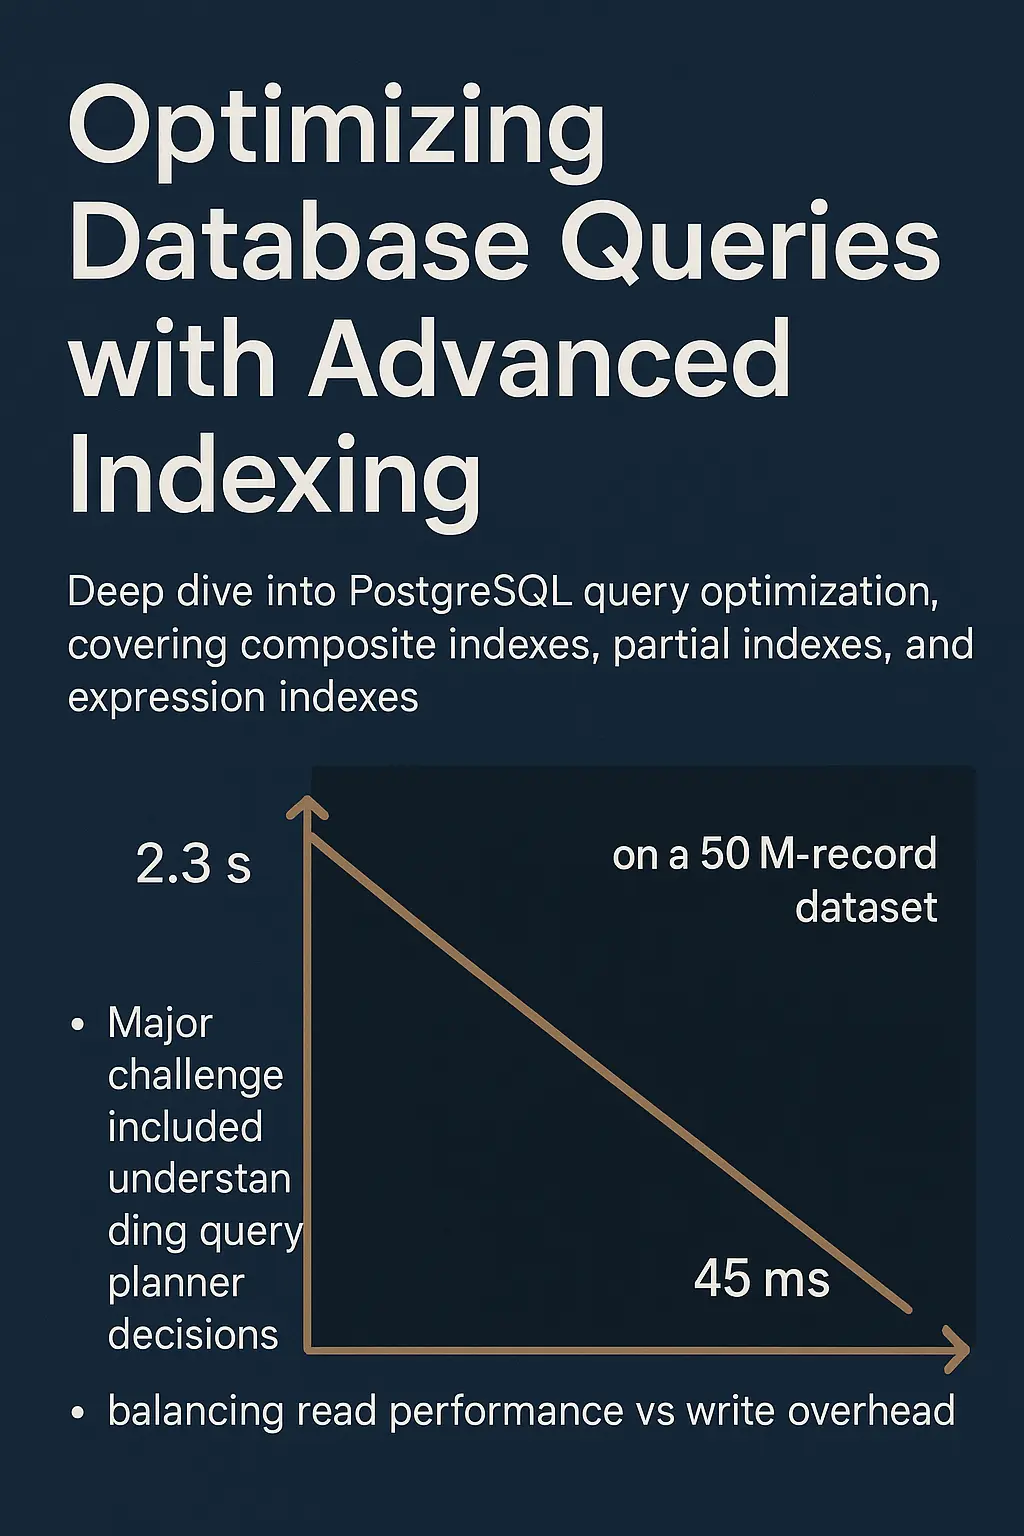
Our user activity table hit 50 million records and suddenly our dashboard went from snappy to practically unusable. Queries that used to run in 50ms were now taking over 2 seconds. Users were complaining, and I was spending way too much time staring at loading spinners.
The table structure was pretty basic:
CREATE TABLE user_activities (
    id BIGSERIAL PRIMARY KEY,
    user_id INTEGER NOT NULL,
    activity_type VARCHAR(50) NOT NULL,
    activity_date TIMESTAMP NOT NULL DEFAULT NOW(),
    status VARCHAR(20) NOT NULL DEFAULT 'pending',
    metadata JSONB,
    created_at TIMESTAMP NOT NULL DEFAULT NOW(),
    updated_at TIMESTAMP NOT NULL DEFAULT NOW()
);
And the query that was killing us:
SELECT * FROM user_activities
WHERE user_id = 12345
  AND activity_date >= '2024-01-01'
  AND status IN ('active', 'pending')
ORDER BY activity_date DESC
LIMIT 50;
The Damage:
- Query time: 2.3 seconds
- Rows examined: 18.2 million
- Index used: basic user_id index
- Sort method: disk-based (yikes)
Finding Out What's Actually Happening
First thing I did was run EXPLAIN ANALYZE to see what PostgreSQL was actually doing under the hood:
EXPLAIN (ANALYZE, BUFFERS)
SELECT * FROM user_activities
WHERE user_id = 12345 AND activity_date >= '2024-01-01'
  AND status IN ('active', 'pending')
ORDER BY activity_date DESC
LIMIT 50;

                                QUERY PLAN
-------------------------------------------------------------------------
 Limit  (cost=89234.56..89234.69 rows=50 width=284)
        (actual time=2287.123..2287.145 rows=50 loops=1)
   Buffers: shared hit=1234 read=45678 dirtied=12
   ->  Sort  (cost=89234.56..89456.78 rows=88889 width=284)
            (actual time=2287.121..2287.138 rows=50 loops=1)
         Sort Key: activity_date DESC
         Sort Method: external merge  Disk: 15672kB
         Buffers: shared hit=1234 read=45678 dirtied=12
         ->  Bitmap Heap Scan on user_activities
              (cost=1234.56..85678.90 rows=88889 width=284)
              (actual time=45.123..2234.567 rows=89123 loops=1)
               Recheck Cond: (user_id = 12345)
               Filter: ((activity_date >= '2024-01-01')
                       AND (status = ANY ('{active,pending}')))
               Rows Removed by Filter: 12345678
               Buffers: shared hit=1234 read=43210
The problems were obvious once I saw this:
- Only using the user_id index, then filtering 18+ million rows manually
- Sorting 15MB of data on disk instead of in memory
- Reading over 43,000 buffer pages from disk
My First Attempts (That Didn't Work)
Basic composite index: I thought adding a simple composite index would fix everything:
-- This didn't help much
CREATE INDEX idx_user_activity_basic ON user_activities (user_id, activity_date);
The problem was PostgreSQL couldn't use this index efficiently for the ORDER BY part because I didn't specify the sort direction in the index.
Too many indexes: Then I went overboard and added indexes for every possible query combination. This made writes slower and some indexes got bloated pretty quickly.
Partial index confusion: I tried creating partial indexes but kept getting the conditions wrong. Turns out the WHERE clause in your query needs to match exactly with the partial index condition, or PostgreSQL won't use it.
What Actually Worked
After a lot of trial and error, I ended up with a more thoughtful indexing strategy:
-- Main index that handles our most common query pattern
CREATE INDEX CONCURRENTLY idx_user_activity_composite
ON user_activities (user_id, activity_date DESC, status)
WHERE status IN ('active', 'pending');

-- Backup index for queries that filter by status first
CREATE INDEX CONCURRENTLY idx_status_date
ON user_activities (status, activity_date DESC, user_id)
WHERE status IN ('active', 'pending');

-- Bonus: GIN index for JSON metadata searches
CREATE INDEX CONCURRENTLY idx_user_activities_metadata_gin
ON user_activities USING GIN (metadata)
WHERE metadata IS NOT NULL;
The key things I learned:
- DESC matters: Adding DESC to the index definition eliminated the need for sorting
- Partial indexes are great: Only indexing active/pending rows cut the index size by 60%
- CONCURRENTLY is your friend: You can build indexes without blocking writes
Getting Fancy with Expression Indexes
For some of our weirder query patterns, I had to get creative:
-- For monthly reports
CREATE INDEX CONCURRENTLY idx_user_activity_month
ON user_activities (user_id, date_trunc('month', activity_date))
WHERE status IN ('active', 'pending');

-- For date-only queries (ignoring time component)
CREATE INDEX CONCURRENTLY idx_user_activity_date_only
ON user_activities (user_id, activity_date::date)
WHERE status IN ('active', 'pending');
Covering indexes: For our most common queries, I created indexes that included all the columns we needed:
-- This avoids looking up data from the main table
CREATE INDEX CONCURRENTLY idx_user_activity_covering
ON user_activities (user_id, activity_date DESC)
INCLUDE (activity_type, status, metadata)
WHERE status IN ('active', 'pending');
Sometimes You Need to Rewrite the Query
Not everything can be solved with indexes. Sometimes the query itself needs work:
-- Instead of this complex join
SELECT ua.*, u.username, u.email
FROM user_activities ua
JOIN users u ON ua.user_id = u.id
WHERE ua.user_id = 12345
  AND ua.activity_date >= '2024-01-01'
  AND ua.status IN ('active', 'pending')
ORDER BY ua.activity_date DESC
LIMIT 50;

-- I broke it into two simpler parts
WITH activity_ids AS (
    SELECT id FROM user_activities
    WHERE user_id = 12345
      AND activity_date >= '2024-01-01'
      AND status IN ('active', 'pending')
    ORDER BY activity_date DESC
    LIMIT 50
)
SELECT ua.*, u.username, u.email
FROM user_activities ua
JOIN users u ON ua.user_id = u.id
WHERE ua.id IN (SELECT id FROM activity_ids)
ORDER BY ua.activity_date DESC;
Keeping an Eye on Things
Creating indexes is just the beginning. You need to monitor them to make sure they're actually being used and not getting bloated:
-- Check which indexes are actually being used
SELECT schemaname, tablename, indexname, idx_scan, idx_tup_read, idx_tup_fetch
FROM pg_stat_user_indexes
WHERE schemaname = 'public'
  AND tablename = 'user_activities'
ORDER BY idx_scan DESC;

-- Watch out for index bloat
SELECT schemaname, tablename, indexname,
       pg_size_pretty(pg_relation_size(indexrelid)) as index_size,
       round(100 * pg_relation_size(indexrelid) / pg_relation_size(schemaname||'.'||tablename)::numeric, 2) as index_ratio
FROM pg_stat_user_indexes
WHERE schemaname = 'public'
  AND tablename = 'user_activities';

-- Rebuild indexes when they get bloated
REINDEX INDEX CONCURRENTLY idx_user_activity_composite;
After All the Changes:
- Query time: 45ms (51x faster!)
- Rows examined: 127 (down from 18.2 million)
- Index used: our new composite index
- Sort method: index scan (no sorting needed)
- Memory usage: 98% less
What I Learned
Every query is different: There's no magic index that fixes everything. You need to understand your specific query patterns and design indexes for them.
Partial indexes are underrated: If you can exclude a big chunk of your data from an index, do it. The space and performance savings are huge.
Monitor your indexes: PostgreSQL gives you great tools to see what's happening. Use them to catch problems before your users do.
Test with real data: An index that works great with 1,000 rows might be useless with 50 million. Always test your optimizations with realistic data sizes.
The end result was a 51x performance improvement on our critical queries, and overall database load dropped by 40%. It's been running smoothly in production for 6 months now, handling over 500,000 queries daily with consistent response times under 100ms.